Site Performance

...but with AI? 🤔
by Ryan Oeltjenbruns
Performant Perspective

Why are some sites faster than others?
Hint: no matter the site, the answer is the
What are we really asking all these computers to do?!!!
Ryan's Rule of Threes for Site Performance
-
Server Processing
Poor performance here is indicated by the TTFB - all of the work the server has to do to render html
-
The Payload
The amount of data required for a pageload - what are we transferring across the wire and where is it coming from?
-
Browser Processing
The instructions we give to the browser to render a page - what are we asking the browser to do and in what order?
Server Processing ...ing ...ing
Different sites have different server performance metrics. Consider the following:
- Database usage, size, and indexing
- File / Disk IO
- Caching Services
- API Calls
The more a server has to do for each page it renders, the likelier that server is going to need Zach's help.
Database Performance
Databases are one of the biggest performance considerations in server performance - ESPECIALLY for WordPress.
- How many queries are we making against the DB per pageload?
- What are we asking about? Are these columns indexed?
- How much data does the DB have to sort through to find your results?
Poor performing queries can always be "explained":
EXPLAIN SELECT * FROM wp_posts WHERE meta_value LIKE "%foo%";
Resource Contention

Yes, I know... I spelled "Unoptomized" and "Optomized" incorrectly 🤣
A server can only do so much work within a given amount of time.
Check out the whitepaper I made for WP Engine 10 years ago (still mostly relevant for WP)
Scaling WordPress for High TrafficThat's where I got that photo from. 2015 me 😁👍
The Payload

Transferring all of the content isn't free either!
A site who's total payload is 10kb will load faster than one that's 10mb (1000x larger).
More on this in the Browser Processing section...
Growing up...
I remember downloading a 3mb song @ 3kb/s.
- Click download
- Go make a sandwich
- Check download...
- Start eating sandwich
- check download again...
- Finish sandwich and go play outside.
~20 minutes later we were jammin' 😁👍
The riaa hadn't found us yet

Nailed it.
Typical payload components
- HTML - <note>the actual document with all the page content and instruction for where to find everything else</note>
- Styles - CSS { Cascading Style Sheets: defining how the browser should render elements; }
- Scripts - <script>// all of the code (typically javascript, but also WASM) that brings functionality to the site in the browser.</script>
- Fonts - fonts give our text style, but boy do they bring the PAYLOAD! Be careful here. Italic is nice, but we should also ask if it is worth another 150kb. (PS - WOFF2 offer ~30% better compression than standard TTF/OTF files!)
- Media - all of the images, icons, audio, video, etc... Though passive, these can have a HUGE impact on performance as well!
Browser Processing
Let's start by discussing some of the interesting limitations modern browsers have - most folks (including devs) aren't familiar with.

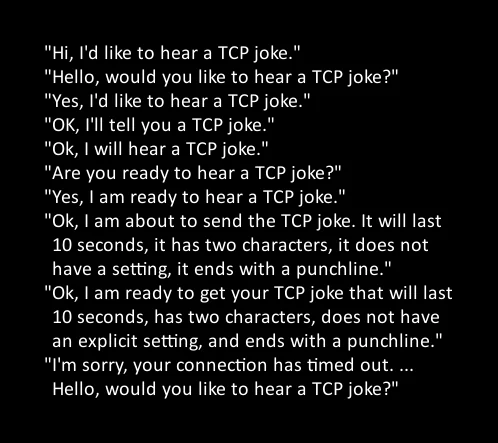
TCP vs. UDP.
I would tell you a joke about UDP, but you probably wouldn't get it. So here's a TCP joke.
http/1.1
Built on TCP, limits the browser to a maximum of 6 concurrent connections
Don't go chasin' waterfalls... unless you're on HTTP/1.1

http/2
Relies on a SINGLE TCP connection with Multiplexing
- DNS lookups are now the expensive part of a site load (splitting assets across domains)
-
If a single packet is dropped, all concurrent downloads involved in that packet are too.
(due to TCP Head-of-Line Blocking) - As a result, http/2 can perform worse than http/1.1 on spotty networks
http/3
Like http/2, but solves the packet conundrum by using QUIC (built on top of UDP)
- Not as common yet
- Fixes TCP's head of line blocking by switching to UDP packets
- If you don't get it though... ehhh nevermind.
The Main Thread
If you don't know about the main thread...

...you're gonna have a bad time.
The Main Thread (cont.)
The main thread handles

...the downloading of the files is non-blocking, but what happens with them is not!
Your Bootstrap 5 + Javascript SPA might be the coolest app since sliced bread, but the browser has to parse, compile, and execute it. During which time...

This is your browser on CSS & Javascript. Any questions?
Shared CDN Caching
...is ded. 👀
Modern browsers now cache assets per TLD (for privacy reasons).
In short: Serve local; don't add another DNS lookup.

In loving memory of cdn.jquery.com
Circa ~2026
Front End Metrics
At least the important ones...
- LCP / Largest Contentful Paint - "The First Impression"
- INP / Interaction to Next Paint - "The Responsiveness Test"
- CLS / Cumulative Layout Shift - "The Frustration Factor"
- TBT / Total Blocking Time - "The Processing Tax"
⬇️ for more info 👍
LCP - Largest Contentful Paint
Translation: How long does it take for the biggest, most important thing on the screen (usually the hero image or main headline) to show up?
- Compress ! (<200kb, right?)
- Do we really need these 17 font files? Cut everything we don't
need ! - Ensure we aren't lazy-loading anything that's visible when the page first loads! (it should load immediately)
INP - Interaction to Next Paint
Translation: When a user taps a button, opens a menu, or adds an item to their cart, how long does it take for the site to visually react?
-
Do we really need all 15 tracking pixels, the live-chat widget, and the heatmap tool running at the same time?
Every third-party tool is going to hold the Main Thread hostage -
Break up long JavaScript tasks so the "brain" can pause and respond to user clicks.
Long (50ms+) processes should be broken up.
CLS - Cumulative Layout Shift
Translation: Does the page jump around while the user is trying to read or click something?
- Are we injecting banner ads at the top of the page without reserving blank space for them first? When the ad finally loads, it's pushing all the text down, causing loading jitters.
- Always define exact height and width attributes for images and videos in the code so the browser leaves an empty "box" for them while they download.
TBT - Total Blocking Time
Translation: How much total time is the browser completely frozen and ignoring the user while it processes our code?
- Do we have too many complex features loading on the initial page load?
- Can we defer non-critical features (like the comments section) until the user actually scrolls down to them?
IT'S LIKE YOU WANTED MORE!!!
![WAHOO!!! GO YOU! =]](./media/celebrate-minion-style.webp)
I'm so proud of you 😁👍
Nothing to see here.

gotcha 😉
One thing we're guilty of 👀
Wrapping all of our tiny scripts and js segments in their own
$(document).ready()
DOMContentLoaded
I'm not calling
This has huge impacts on Total Blocking Time (TBT), followed immediately by terrible Interaction to Next Paint (INP).

That's a double whammy!
The correct approach
Since we're bundling with Webpack, strip out the
document.ready
Now that you know some stuff...
Where Does AI Fit?
And how can I use it for the benefit of our clients' websites?
I gotchu - 4 ways to use AI to suss out performance issues.
The "Lighthouse JSON" Auditor
- Best For: TBT & LCP (Total Blocking Time & Largest Contentful Paint)
- Difficulty: Easy 👍
Run a Lighthouse test in Chrome DevTools, click "Export JSON", upload the file to their AI of choice, and try this prompt:
Act as a Senior Web Performance Engineer. I have uploaded my raw Lighthouse diagnostic JSON. Please analyze the data and identify the top 3 biggest bottlenecks impacting Total Blocking Time (TBT) and Largest Contentful Paint (LCP). For each issue, provide one permanent technical fix for the development team, and one immediate, temporary mitigation strategy the marketing/ops team can implement today.
The "Third-Party" Spotlight
- Best For: INP (Interaction to Next Paint)
- Difficulty: Easy 👍
Load the site in your browser, wait for it to fully load, go to the Elements tab, right-click the <body> tag, select "Copy outerHTML", and paste it in along with this:
I am pasting the fully rendered HTML of my website. Act as a performance auditor and identify all
third-party scripts (trackers, chat widgets, ad pixels) injected into this page that are likely
fighting for the Main Thread. Rank them by their potential negative impact on Interaction to Next
Paint (INP). Suggest a strategy to delay, defer, or lazy-load the heaviest offenders without
breaking their core functionality.
```html
[Paste your copied html code here]
```
Why like this? Because we're looking at the actual rendered DOM --
The "Main Stampede" Hunter
- Best For: TBT & INP(Total Blocking Time & Interaction to Next Paint)
- Difficulty: Medium 🤓
Copy the compiled site Webpack JS files and use this prompt to hunt down third party shenanigans:
I am pasting a compiled JavaScript file used on our WordPress site. Scan this code specifically for `$(document).ready`, DOMContentLoaded, or similar event listeners that could cause a 'stampede' of execution on the Main Thread right after the HTML parses. Highlight the specific lines causing the bottleneck, and provide a rewritten, modern example using defer or ES modules to fix the Total Blocking Time (TBT) impact.
The "Nerdspeak Translator"
- Best For: Fluently speaking Greek (by that I
mean nerd). - Difficulty: Easy 👍
When you just need to explain a bad PageSpeed Insights score to a client or boss 👀
Once the report completes, use the "Print to PDF" feature and upload that to the LLM.
(Frontier models can just accept the report's URL)
I am going to provide the URL of a PageSpeed Insight Report for you to review the Core Web Vitals (LCP, INP, CLS). Translate these technical failures into a short, 3-bullet-point summary for a non-technical executive. Do not use engineering jargon. Focus entirely on how these specific bottlenecks are currently causing user frustration, abandonment, and lost conversions, using simple real-world analogies.
Sidenote: No offense to executives, but it's critical that they have clarity whether or not they have the technical chops to interpret these things. It's the perfect prompt.